
TrueBuildCost

Top 20

Compare 20 places to build.

A planning shortlist synthesized from 2025–26 migration and homebuilding interest. Each row is the same average program: ~2 acres, 2,000 sq ft, builder finish—local multipliers only.

  • 01

    Des Moines, IA

    Top homebuilding + affordability metro in 2026 rankings

    Avg build

    $429k

    $361k–$583k

    BEA RPP

    91.7 / 100

    vs $4,710/yr tax*

    Summary
    BuildLiving
  • 02

    Raleigh, NC

    A+ build market; strong inbound migration

    Avg build

    $504k

    $420k–$733k

    BEA RPP

    98.2 / 100

    vs $4,111/yr tax*

    Summary
    BuildLiving
  • 03

    Knoxville, TN

    Highest projected in-to-out move ratio for 2026

    Avg build

    $451k

    $377k–$641k

    BEA RPP

    92.6 / 100

    vs $2,859/yr tax*

    Summary
    BuildLiving
  • 04

    Austin, TX

    Sun Belt build volume and job growth

    Avg build

    $576k

    $476k–$864k

    BEA RPP

    98.1 / 100

    vs $10,475/yr tax*

    Summary
    BuildLiving
  • 05

    Houston, TX

    High permit volume and relatively buildable land

    Avg build

    $513k

    $428k–$733k

    BEA RPP

    98.6 / 100

    vs $8,058/yr tax*

    Summary
    BuildLiving
  • 06

    Jacksonville, FL

    Florida inbound demand with room to build

    Avg build

    $518k

    $429k–$767k

    BEA RPP

    99.5 / 100

    vs $5,200/yr tax*

    Summary
    BuildLiving
  • 07

    Boise, ID

    Mountain West relocation favorite

    Avg build

    $528k

    $438k–$781k

    BEA RPP

    98.4 / 100

    vs $3,524/yr tax*

    Summary
    BuildLiving
  • 08

    Nashville, TN

    Jobs + lifestyle draw across the South

    Avg build

    $498k

    $414k–$734k

    BEA RPP

    96.3 / 100

    vs $3,565/yr tax*

    Summary
    BuildLiving
  • 09

    Charlotte, NC

    Banking hub with steady new construction

    Avg build

    $485k

    $404k–$699k

    BEA RPP

    97.3 / 100

    vs $3,879/yr tax*

    Summary
    BuildLiving
  • 10

    Oklahoma City, OK

    Affordable build market with active permitting

    Avg build

    $407k

    $343k–$551k

    BEA RPP

    90.4 / 100

    vs $2,433/yr tax*

    Summary
    BuildLiving
  • 11

    Phoenix, AZ

    Large-metro migration leader in the Southwest

    Avg build

    $538k

    $448k–$778k

    BEA RPP

    103.3 / 100

    vs $2,963/yr tax*

    Summary
    BuildLiving
  • 12

    Indianapolis, IN

    Midwest affordability and homebuilding strength

    Avg build

    $456k

    $384k–$622k

    BEA RPP

    95.7 / 100

    vs $2,764/yr tax*

    Summary
    BuildLiving
  • 13

    Orlando, FL

    Central Florida inbound house-hunter demand

    Avg build

    $528k

    $436k–$800k

    BEA RPP

    101.4 / 100

    vs $5,655/yr tax*

    Summary
    BuildLiving
  • 14

    San Antonio, TX

    Texas growth corridor; strong net inflows

    Avg build

    $496k

    $415k–$709k

    BEA RPP

    94.7 / 100

    vs $7,824/yr tax*

    Summary
    BuildLiving
  • 15

    Tulsa, OK

    Rising inbound interest among mid-size metros

    Avg build

    $406k

    $342k–$547k

    BEA RPP

    89.2 / 100

    vs $2,348/yr tax*

    Summary
    BuildLiving
  • 16

    Myrtle Beach, SC

    Coastal relocation + new residential communities

    Avg build

    $459k

    $383k–$664k

    BEA RPP

    93.6 / 100

    vs $2,642/yr tax*

    Summary
    BuildLiving
  • 17

    Wilmington, NC

    Top inbound city share in recent mover data

    Avg build

    $489k

    $407k–$712k

    BEA RPP

    97.9 / 100

    vs $4,041/yr tax*

    Summary
    BuildLiving
  • 18

    Columbia, SC

    High homebuilding grade in the Southeast

    Avg build

    $435k

    $364k–$609k

    BEA RPP

    93.7 / 100

    vs $2,170/yr tax*

    Summary
    BuildLiving
  • 19

    Columbus, OH

    Midwest build + affordability standout

    Avg build

    $503k

    $423k–$687k

    BEA RPP

    95.5 / 100

    vs $5,361/yr tax*

    Summary
    BuildLiving
  • 20

    Savannah, GA

    High 2026 inbound interest among mid-size cities

    Avg build

    $466k

    $389k–$668k

    BEA RPP

    95.2 / 100

    vs $4,142/yr tax*

    Summary
    BuildLiving

*Property tax is an illustrative state-average rate on a mid-tier home value—not your county bill. Rankings are a planning shortlist, not a census or MLS ranking. Numbers exclude financing and contingency buffer.

Projects & remodel

Need a range for one job?

Roofing, HVAC, kitchen, and more—ZIP-tuned planning ranges for a single remodel or improvement, not a whole new house.
Browse projectsRemodel ROI
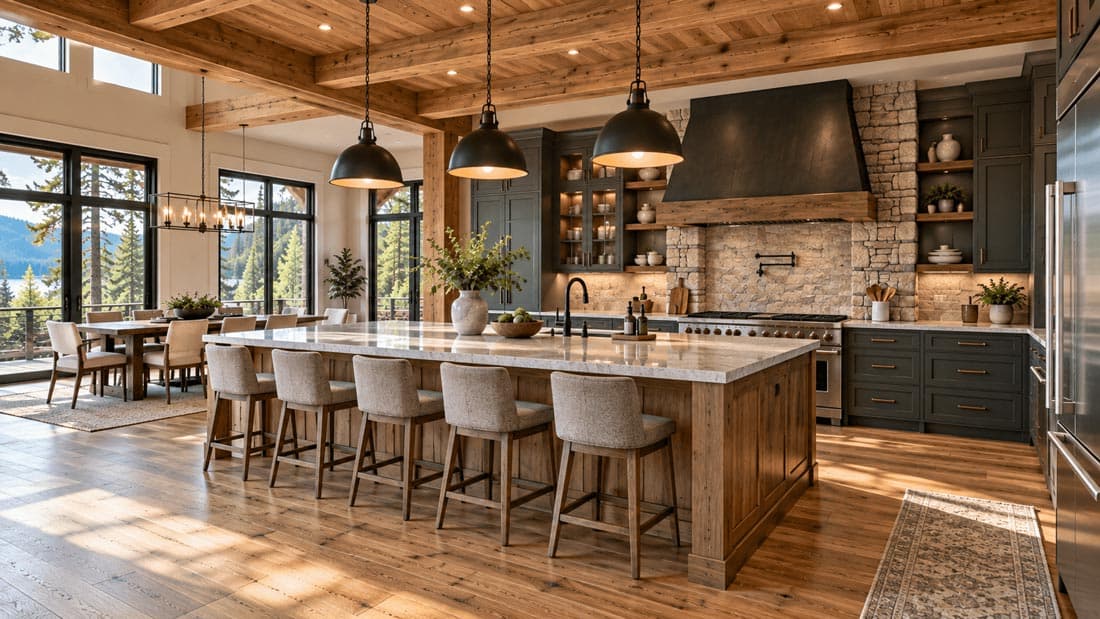
Kitchen remodel
TrueBuildCost

ZIP-tuned planning ranges for a full house build or a single remodel—made to clarify what’s involved before the first bid.

Start with your ZIPBrowse projects

New home

  • Estimate a full house
  • How estimates work
  • Land & build checklist
  • Cost by state
  • Top 20 places
  • Compare builds

Projects

  • Browse projects
  • How project estimates work
  • Remodel checklist
  • Remodel ROI

Tools

  • Material calculators
  • Projects
  • Remodel ROI

Company

  • About
  • Privacy
  • Terms

© 2026 True Build Cost·Planning ranges, not contractor bids

AboutPrivacyTerms